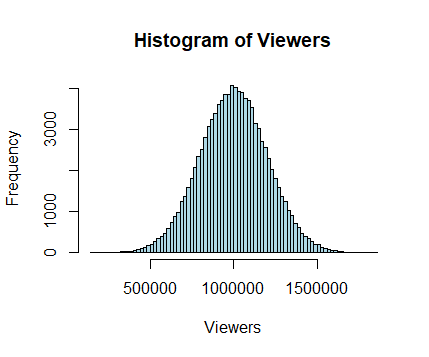
In reality, much of what we call luck or chance is actually just natural variation. If for example, we consider TV viewing figures for televised soccer matches, we might find that these conform to a normal distribution, similar to that shown in Figure 1. If the average match viewing figure is say 1 million, then because of central tendency we can be pretty sure that the viewing figures for most matches will be somewhere near this value. With a normal distribution, 68.27% of the observations lie within one standard deviation of the mean. Having said this, on occasions extreme values can occur just by chance. So, for example, its entirely possible that for one game the viewing figures could be as low as 0.5 million, or as high as 1.5 million. However, these will be rare events, and will generally be followed by viewer ratings in subsequent matches that are likely to be much closer to the mean value. Statisticians call this process regression to the mean, and although it is an entirely natural phenomenon, many people fail to spot this when it occurs, with potentially disastrous consequences.
Failure to recognise regression to the mean
Failure to recognise regression to the mean is a very common mistake that many people make, especially in the corporate world where performance is monitored, and maintaining share price is an issue of the highest priority. In this respect, professional football is no different. If performance on the pitch drops below an expected standard, then heads quickly roll, and managers get replaced, which can be a very disruptive and expensive process. For example, Chelsea paid severance fees of £12.6 million and £18 million to Luiz Felipe Scolari in 2009 and Jose Mourinho in 2007, respectively, following their dismissals [1]. So, we need to be able to distinguish whether or not regression to the mean is taking place. Otherwise, we might be making a costly mistake.
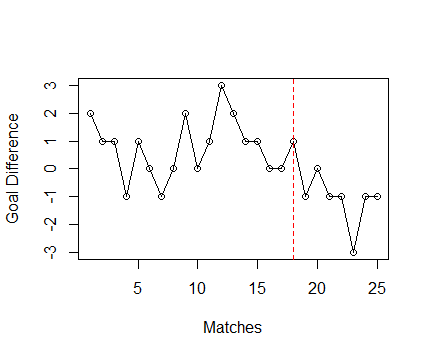
But how good are we at spotting regression to the mean? Consider, the time-series data in Figure 2, which shows the goal difference for fictitious team in the first 25 matches of the Premier League. From this we see that things were going pretty well up to round 18, with the team accumulating 35 points. However, after this there was a serious dip in form, with only one point earned out of a possible 21 points. Clearly, a very unsatisfactory situation, and one in which many clubs would sack their manager. But is the dip in the team’s form just an example of regression to the mean? Could it be that the dip in form is just due to random variation that naturally occurs, and that given time, the goal difference will drift back towards the mean value?
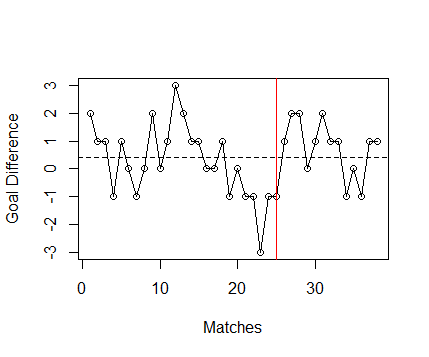
Well, let’s assume that in this instant that the club does not sack the manager, and we fast forward to the end of the season. In Figure 3 we see the match goal differences for all 38 matches in the season, with the red vertical line indicating the 25th match. From this we see that the form of the team did indeed recover after round 25, with them winning nine of their remaining matches and earning a respectible 68 points total.
After round 25, the goal difference regressed back to the mean, which in this case was +0.42 goals per game over the whole season. We can also see that the dip in form that occurred in rounds 19 to 25 was not actually that remarkable, as it matched a similar run in the opposite direction that occurred between rounds 10 and 16. So, here, the dip in form appears to have been followed by a regression to the mean, which is what statisticians would expect to happen if no structural change has occurred.
Replacing the manager
Managerial turnover in soccer is notoriously high, with the average tenure of a professional football manager being only about two years. So, if regression to the mean is such a well-known and common phenomenon, why then are so many team managers sacked? Well, the simple answer to this, is that when form dips (as in Figure 2), clubs come under immense pressure from investors, fans and the media to do something, and the easiest course of action is to replace the manager, whether or not it is actually necessary. Indeed, statistical analysis undertaken by Beggs and Bond [2] of six Premier League clubs over 23 consecutive seasons suggests that in the long-run only very few managerial changes make any difference to the performance of teams, with most just being a costly exercise in maintaining the status quo.
Think before you act
The take-home message from this article is be aware of the regression to the mean, and beware of expensive management consultants who seek exploit the phenomenon. If we throw a ball in the air, it will fall back to Earth of its own accord. We don’t need to buy a new ball, or employ an expensive drone to shepherd it back down. Yet in the commercial world, millions of dollars are spent annually on expensive consultants to fix apparent problems that would otherwise fix themselves. Similarly, in soccer, although managerial change is the popular option, it is not always necessary. Remember, regression to the mean is a real phenomenon, which is very much alive and kicking in soccer. So, consider this option first before embarking on any big structural changes.
References
- Flint SW, Plumley DJ, and Wilson RJ. You don’t know what you’re doing! the impact of managerial change on club performance in the English Premier League. Managing Leisure. 2014. 19(6): 390-399.
- Beggs C, Bond AJ. A CUSUM tool for retrospectively evaluating team performance: the case of the English Premier League. Sport, Business and Management: An International Journal. 2020. 10(3):263-289.
Copyright: Clive Beggs